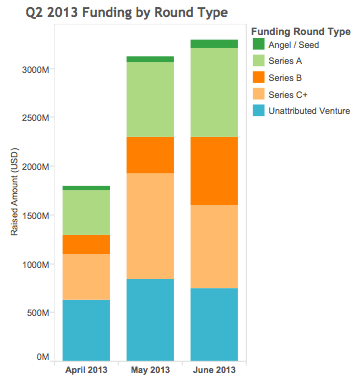
Total new capital invested in the United States tech industry rose from $1.9 billion in April to $3.8 billion in June, a 100 percent increase in two months, according to quarterly data from CrunchBase. The data, which is specific to the United States, breaks down new venture capital raised by round type, investor, company, geography and more.
In the second quarter of 2013, $9.2 billion was invested in over 1,347 rounds. The rounds break down to 500 angel rounds, 306 Series A, 109 Series B, 102 Series C and later, and 330 unattributed rounds. This data set doesn’t include some investments, such as private equity and post-IPO investments, and thus is lower than the total funding for the quarter.
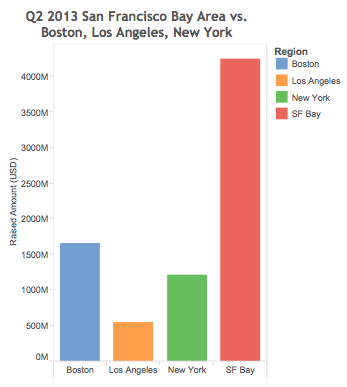
The San Francisco Bay Area still dominates other regions, as companies in the Bay Area raised more capital in Q2 than Boston, New York, and Los Angeles, the next three regions in total capital raised, combined.
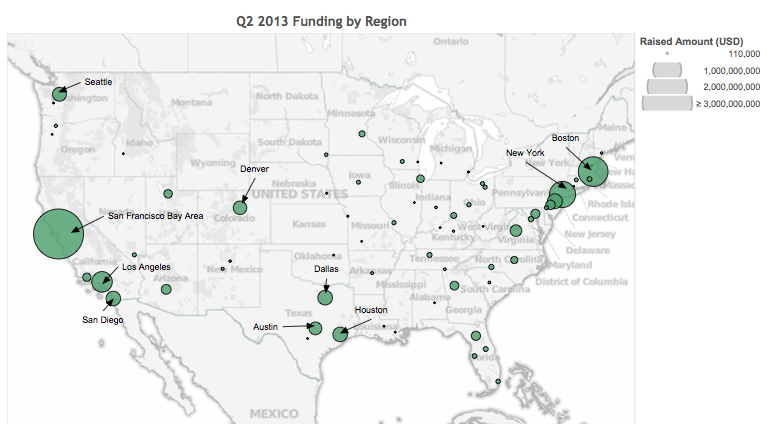
Bay Area companies raised $3.2 billion in 316 rounds, while Boston companies raised $1 billion in 84 rounds and New York startups raised $800 million in 142 rounds. Los Angeles companies raised a bit under $500 million in 81 rounds.
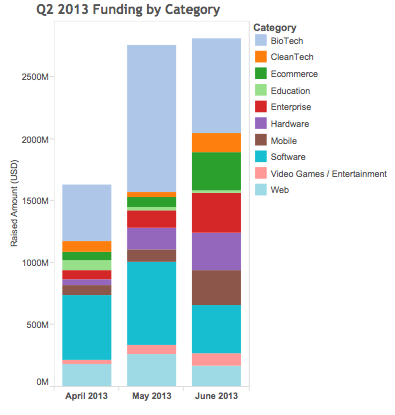
Biotech companies led the way in amount of money raised, followed by software startups. On average, Biotech companies captured 30 percent of total funding per month, followed by software at 19 percent.
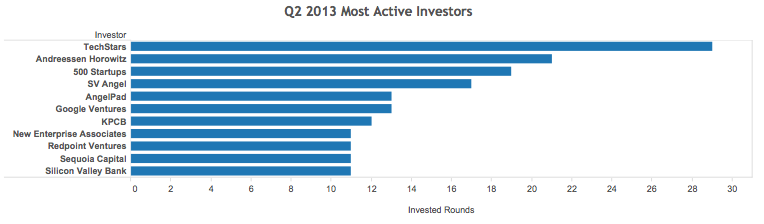
The most active investors, in terms of number of rounds they participated in, were TechStars, Andreessen Horowitz, 500 Startups, SV Angel, AngelPad, and Google Ventures.
All data for this story comes from CrunchBase, TechCrunch’s free database of companies. You can check out CrunchBase’s monthly reports and download the full data set for Q2 here.
Note: not all funded companies have a category and/or region set. Almost all do, but not 100 percent, so there is a bit of a discrepancy across the data depending on how it is sorted.
Graphs and data analysis for this story were done by CrunchBase’s Eddy Kim.