Continuing to grow its suite of services aimed at mobile app developers, Amazon today announced App Engagement Reports, free app usage reports that are now a part of the company’s Mobile App Distribution Portal. The reports are designed for Amazon Appstore developers in need of information about app performance and revenue.
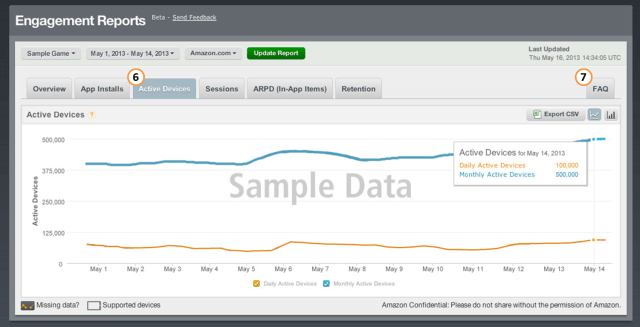
Specifically, the reports include daily and monthly active devices, installs, sessions, average revenue per device, and retention metrics, and they can be filtered by marketplace, viewed in chart form, or downloaded as a CSV, the company explains in this afternoon’s official announcement. Developers will also be able to change the data range on the reports in order to see historical trends.
There are six Engagement Reports now being provided:
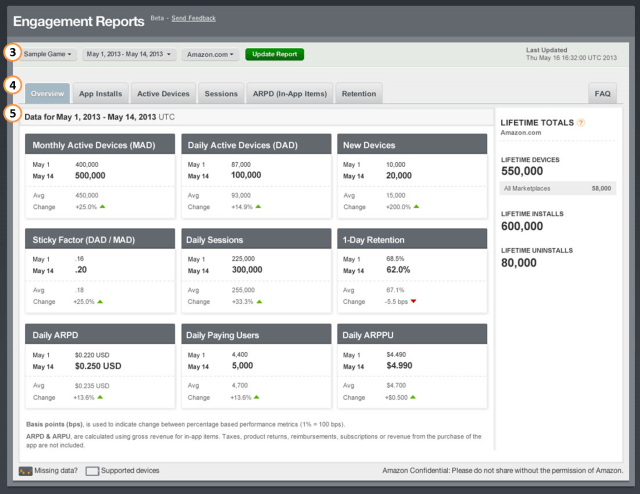
- Overview: A summary of key usage data for your app or game
- Average Revenue: Daily and Monthly Average Revenue per Device (ARPD) and Average Revenue per Paid User (ARPPU) for In-App Items
- Retention: Daily Retention for days 1-3-7 and Weekly Retention for weeks 1-2-3
- Active Devices: Daily Active Devices (DAD), Monthly Active Devices (MAD), and Sticky Factor (DAD/MAD)
- Sessions: Total Daily Sessions and Average Sessions Per Device
- App Installs: Daily Installs and Uninstalls
At launch, the reports are only available for those apps that were submitted and published after October 25, 2012. For developers who haven’t updated their apps since then, they’ll need to either republish the app or submit an update in order to activate the reporting feature. However, there’s no need to make any other changes to the app’s code or integrate any additional software.
The report will include data for apps running on Amazon devices like the Kindle Fire and Fire HD, as well as any other Android devices running the latest version of the Amazon Appstore mobile app.
App analytics and sales figures are crucial to making Amazon’s Appstore a more complete service – these things have long been standard features of competing stores like Google Play or Apple’s iTunes, for example. Though many developers still integrate third-party SDKs to allow for increased capabilities and more detailed reporting beyond what comes out-of-the-box, it’s expected for the Appstore itself to at least provide some sort of basic insight into an app’s traction and sales. Amazon says that reports have been a “popular request from developers,” and that’s likely an understatement.
The addition of the new Engagement Reports comes on the heels of several other changes Amazon has introduced in recent months to beef up its Appstore offerings for developers. Not only has it been expanding its footprint globally, the company has also added features like in-app payments, subscriptions, and even its own virtual currency, Amazon Coins, in order to give developers more revenue generation possibilities.
Now that developers have had a little time to experiment with those new offerings, it only makes sense that they should be able to track how well those features are performing, and whether or not they have an effect on key metrics like ARPU (average revenue per user) and retention.
Additional information about the various parts of the reports and how to access them are explained here. Meanwhile, an Engagement Reports FAQ offers the answers to even more specific questions about the new reports.