If you have ever tried to use SPSS you know the nightmare that it can be when trying to do even simple analysis. SPSS is designed for statisticians to analyze data sets. But even statisticians find it aggravating to perform such tasks as making a neat graphic to show the relationship between variables.
So here’s what happens. You hire a consultant who can do it for you. That’s why IBM, which owns SPSS, has thousands of analysts on its payroll.
Statwing is a Y-Combinator startup that translates the arcane technical terminology into plain english so you can do data analysis on your own.
Co-Founder Greg Laughlin explains that Statwing is designed to make it easier to ask questions about data. I agree but I also think there is something more to the service. It’s another example of how the interface is getting abstracted. Statwing make it easier to do what used to be required of someone with deep technical knowledge about statistics. We see this trend a lot these days. Expertise is not required to do any number of tasks. I can write this blog post and post it immediately. I do not need technical help to do that.
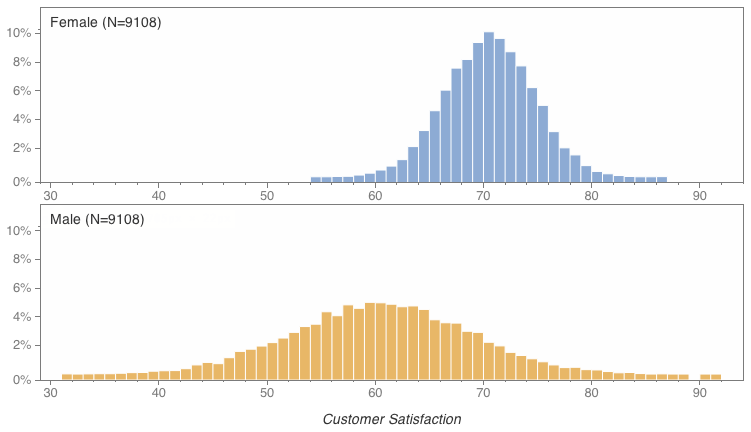
You can see this when comparing Statwing with SPSS. The difference: Statwing comes with visualization, a summary sentence, and plain English translation. Technical jargon like “p-value” is hidden in the advanced tab.
Here’s the output for the SPSS analysis:
Here’s the Statwing output of the same data:
And the accompanying text:
Using the service is pretty simple. You upload correctly formatted data and then pick different variables to look at such as gender and geographic location. Data can be uploaded from your computer, Google Drive, Dropbox, GMail, a Web site URL, GitHub and Box.
It is then pretty simple to use. You choose what variables you want to compare and the service then gives you the analysis. You can see a demo here.
Statwing is now free. It will eventually change to a freemium model.
Statwing reminds me of Tableau with its analysis and easy data visualization. I like the service in that it helps people like myself do analysis that I could not do before.
But Statwing is not dead simple quite yet. It needs more iterations to be more explanatory about why a certain analysis did not work. The company’s greatest challenge will come in extending the data sources that the service can pull from. As those data sources get increasingly complex, Statwing will need to stay focused on its core value of helping people like myself who want answers without needing to learn a host of new technical skills.


