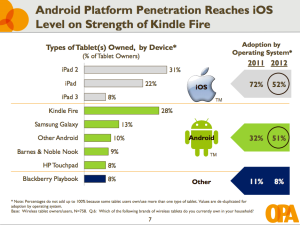
Apple has captured mindshare in the tablet market with its iPad, but when it comes to actual usage, in the U.S. it is actually neck-and-neck with its chief rival, Android, according to a new study out (direct link here) from the Online Publishers Association. The group found that while iPad ownership outweighed that of Android tablets in 2011 — 72 percent to 32 percent — this year those shares have evened out, at 52 percent vs. 51 percent, with a large part of that Android boost coming from the Kindle Fire.
The other striking detail in the study is that U.S. tablet usage is growing fast. Currently tablet owners use their devices for 13.9 hours per week on average, with 74 percent using it daily, and some effective business models developing around that in both paid content and advertising. The OPA predicts that penetration will likely approach a tipping point by the end of next year: by 2013, it says 47 percent of consumers will own a tablet, up from a mere 11 percent in 2011: that’s pretty impressive growth considering that even with smartphones taking a massive leap forward with the iPhone in 2007 it’s taken nearly five years for the majority of U.S. consumers to own a smartphone device.
“Considering tablets have only been available for a little over two years, the findings of this study truly underscore the possibilities for publishers to grow their business as consumers are willing to open their wallets in order to have original content at their fingertips,” said Pam Horan, president of the OPA, in a statement.
The Kindle Fire is by far the most popular “Android” tablet — despite it being built on a forked version of the Google operating system. It accounts for 28 percent of all tablets, more than double the next-biggest Android player, Samsung, with its many sizes of Galaxy Tab. That puts ownership of the Kindle Fire at nearly the same level as the most popular iPad, the iPad 2, and well ahead of the new iPad.
The survey puts special emphasis on how tablets are getting used today. It says that “accessing content and information” is done by 94 percent of tablet owners with a very healthy 61 percent paying for that content. Some 67 percent use tablets for internet access; 66 percent use them to check email. Within that video, at 54 percent, is the most popular activity; with weather information at 49 percent, and accessing national news only at 37 percent (sorry for the bad news, OPA publisher members!).
Apps figure prominently in that high amount of content consumption: 70 percent of tablet users “keep and use regularly” at least half of the apps ever downloaded, and this year will spend $2.6 billion on app purchases, up from $1.4 billion in 2011.
These are high numbers that point to how the form factor of a tablet may make them a much more natural vehicle for regular content consumption than the smartphone — despite the convenience of the latter.
This is the second year that the OPA has conducted this study. It is conducted in partnership with Frank N. Magid Associates and is based on an online survey of 2,540 internet users between the ages of 8 and 64. It notes that the sample was matched to the U.S. Census with regard to age and gender, which found that the overall U.S. Internet population reflected in the sample (ages 8-64) as 236.2 million people in 2011, 243.2 million in 2012 and 249.7 million in 2013. The OPA’s data was collected March 19-26 of this year.
Although paid content is coming along nicely, there is also a big push for the other chief form of revenue generation around content: advertising. Some 38 percent of users say they have made a purchase after seeing an ad on a tablet, spending on average $359 on products in the last year as a result. A further 29 percent have researched products and 23 percent have clicked through on ads, it notes. The big question will be whether some of that behaviour is due to novelty, or whether it will hold as the tablet market further matures. (In online ads, for example, click-through rates have been seen to decline over the years, perhaps as people have become more desensitized.)

