Research firm research2guidance in conjunction with Android expert and developer network AndroidPIT this morning published a report that offers key findings from an analysis of mobile app trends in the Android Market. The first point is perhaps not so surprising: Although we think of Android as having significant global reach as a mobile operating system, the U.S. remains (by far) the largest market for Android apps. According to the study, with over 3.49 billion total downloads as of September 2011 and with 50 percent of Android app downloads (to date) originating at home, the U.S. is dominating the Android app market.
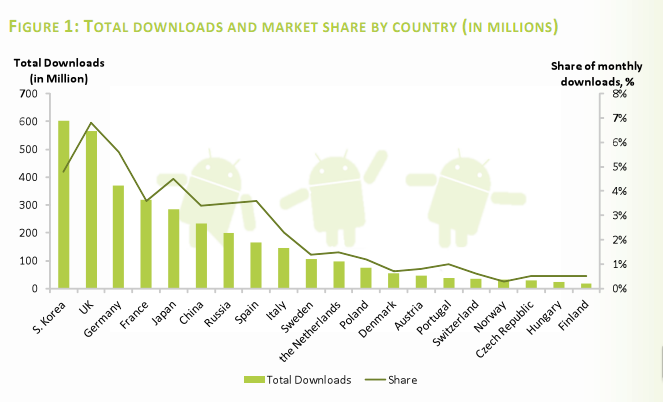
However, the research firm is quick to point out that, although the U.S. leads, there is some saturation happening here, while other markets abroad have come to represent significant potential growth areas — and hotbeds of activity. In fact, (though this may not be news, it doesn’t seem to be widely covered in the U.S.), South Korea has the second largest market in terms of app downloads — even though it lags behind the U.S. with a small-ish 9 percent market share. In fact, to date, South Korea had the highest number of total app downloads after the U.S., at 603 million.
South Korea has relatively high Android smartphone penetration and a high number of app downloads (per user). According to research2guidance Co-founder Markus Pohl, South Korea’s growing share is supported by the country’s extensive IT infrastructure, which not only is known for its high speed and extensive coverage, but also for being fairly inexpensive, around $0.45 per Mbs compared to $11 in the U.K., for example. (South Korea is also home to major OEMs, like Samsung.)
South Korea is followed by the U.K., Germany, France, and Japan — all of which are currently tallying over 20 million downloads per month. And, what’s more, the study shows that users based in the largest Android markets are not always the most active app downloaders. User download behavior varies widely between markets, but it seems that potential “cash cow” markets are to be found in, perhaps, unexpected places.
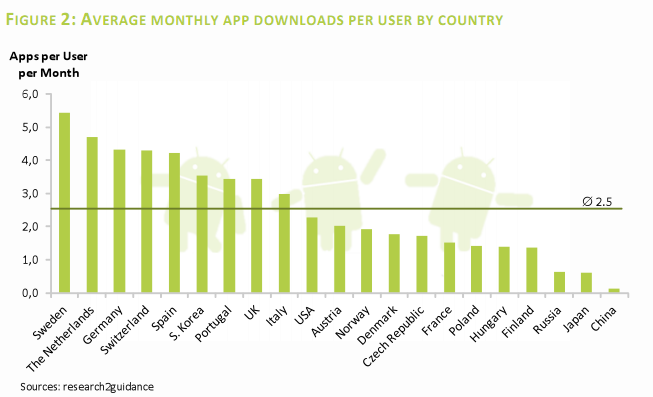
Sweden, for example, has a relatively low market share (and low smartphone penetration) compared to the rest of the world, but it has the highest average monthly app downloads per user — at a rate of over 5 apps per user per month. This is compared to the average user in major Android markets, which downloads 2 to 3 applications per month.
Obviously, higher average downloads per user show the market’s rate of absorption and growth potential, as higher numbers can indicate the society’s openness towards new apps and the fact that total app downloads in these countries could increase with less marketing efforts compared to countries with less active users, Pohl said.
On the other hand, Russia and China have very low Android smartphone penetration rates and very low app downloads per user. Granted, while a much lower rate of downloads per user might show that these markets aren’t yet ready for Android apps to really take off, the relatively young target market and their population size could have significant impact on app market development in these countries, and Pohl sees them becoming huge Android adopters in the near future.
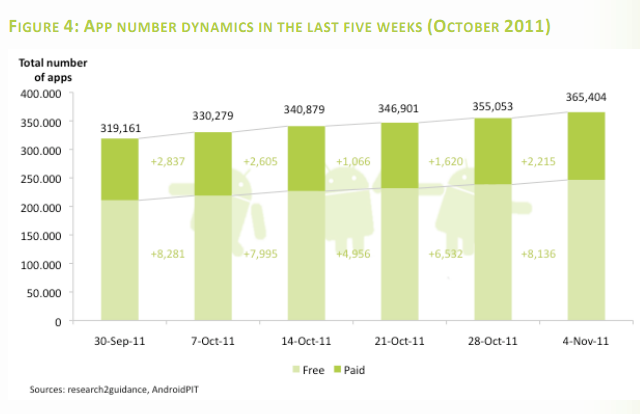
As to apps in the Android market seen as a whole, over the past few months, the report finds, the number of apps has grown “faster than ever”. Every week publishers are releasing 11,000 new apps to the market, compared to an average of 7,500 during the summer. At the end of October, for example, the number of total apps was 365,404 — a growth of over 40K total apps since Robin wrote about the market less than a month ago.
Of the total apps, the share of paid apps dropped to 32.4 percent, as “publishers are increasingly aware that Android users are unwilling to pay for downloads”, which is, in turn, catalyzing the adoption of in-app billing and advertising. Furthermore, in October , developers charged an average of $3.06 for paid apps, and prices ranged from $0.99 to $14.87.
For more, check out research2guidance’s full report here.


