About a month ago, I was one of the very first people to ride an Uber car in New York City a few hours after the company put a few test cars out on the streets. It was supposed to be a secret, but I found out about it, and texted Uber CEO Travis Kalanick while I was in the car. Last night was Uber’s “official” launch in New York City with about 100 cars which can be summoned via an iPhone app. Kalanick spent some of his recently raised $11 million to host a fancy dinner at Del Posto.
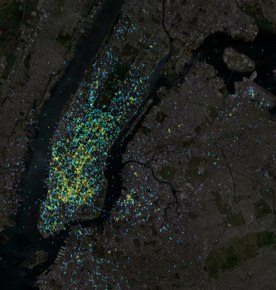
I talked to Kalanick about the launch (watch the video below), and during the dinner he showed everyone some incredible slides depicting heat maps of San Francisco (where Uber is fully launched) and New York City. These slides really drive home how Uber is using data to gain a competitive advantage, gauge demand, and get its model right. The map at right shows all the places in New York City where the Uber app was opened even before the service was available. (I guess I wasn’t the only one waiting for it—Boston, Chicago, D.C., and Seattle are next).
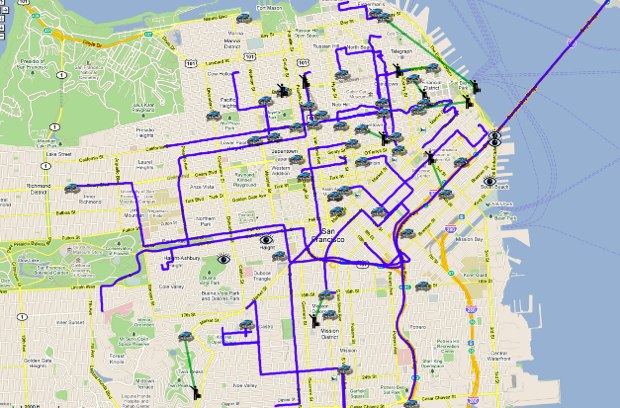
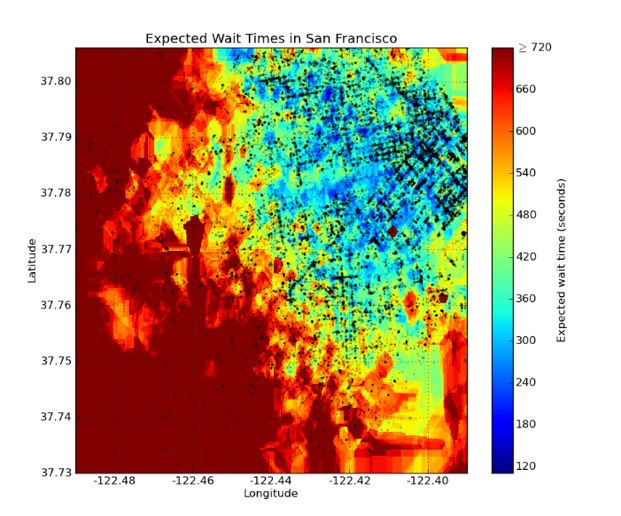
When Uber launches in a city, it keeps a “God’s Eye” view of all the cars, trips and passengers on the streets at any given time (see first screenshot below). It also uses heat maps (see second screenshot below) to measure expected wait times to determine where demand is and where it might need to place more cars.
Uber is going up against very entrenched players in the car livery and taxi industries. If it is going to beat them, it will have to be smarter and use this kind of data as its competitive weapon. None of this, of course, would be possible without smartphones that can transmit the locations of both cars and customers. Thanks to technologies like the iPhone and Android, Uber can collect this data and create a dispatch system that blows away anything else out there.